I promissed on Twitter that we will be releasing something fun this Friday so here it is.
Introduction
How do you debug the HTTP traffic in web applications - especially in NodeJS? I tend to do a lot of logging but this is a very tedious process and it is slow. Another option is to install a proxy between your client and the server recording all the HTTP traffic in between. Easier said than done. Not every client is subject to proxing and even if you manage to convince it to use your proxy you may have to resolve issues with certificate pinning, extra checks done on the signatures of the remote certificate, etc. This is can be a never-ending pain!
There is a better way though. What if we can use the same simple protocol we utilise in our pown-proxy but integrated directly into the server process. That way, if we start the server process with some special flags or environment variable switches, we will have a full visibility of what the server and the connecting clients are doing.
Here is a Demo
Everything is explained better with demos. First, let's build a simple HTTP server and hook the Inseptor. We provide a simple library for the job but to be honest this is not even required as the heavy lifting is not done in the server but the client. You can build your own inseption server in a few lines of code. For this demo we will just use the library:
$ npm install --save-dev inseptor
Now we need to create the server. In our case, it is just a simple "Hello World!" server:
const http = require('http')

const server = http.createServer((request, response) => {
  response.end('Hello Node.js Server!')
})

server.listen(process.env.PORT || 3000, (err) => {
  if (err) {
    console.err(err)
  } else {
    console.log(`server listening on ${process.env.PORT || 3000}`)
  }
})
Now let's hook the node-inseptor library. We need to add 3 lines of code in total. The final script looks like this:
const http = require('http')
const { startInseptServer, inseptServer } = require('inseptor')

const server = http.createServer((request, response) => {
  response.end('Hello Node.js Server!')
})

server.listen(process.env.PORT || 3000, (err) => {
  if (err) {
    console.err(err)
  } else {
    console.log(`server listening on ${process.env.PORT || 3000}`)

    startInseptServer()
    inseptServer(server)
  }
})
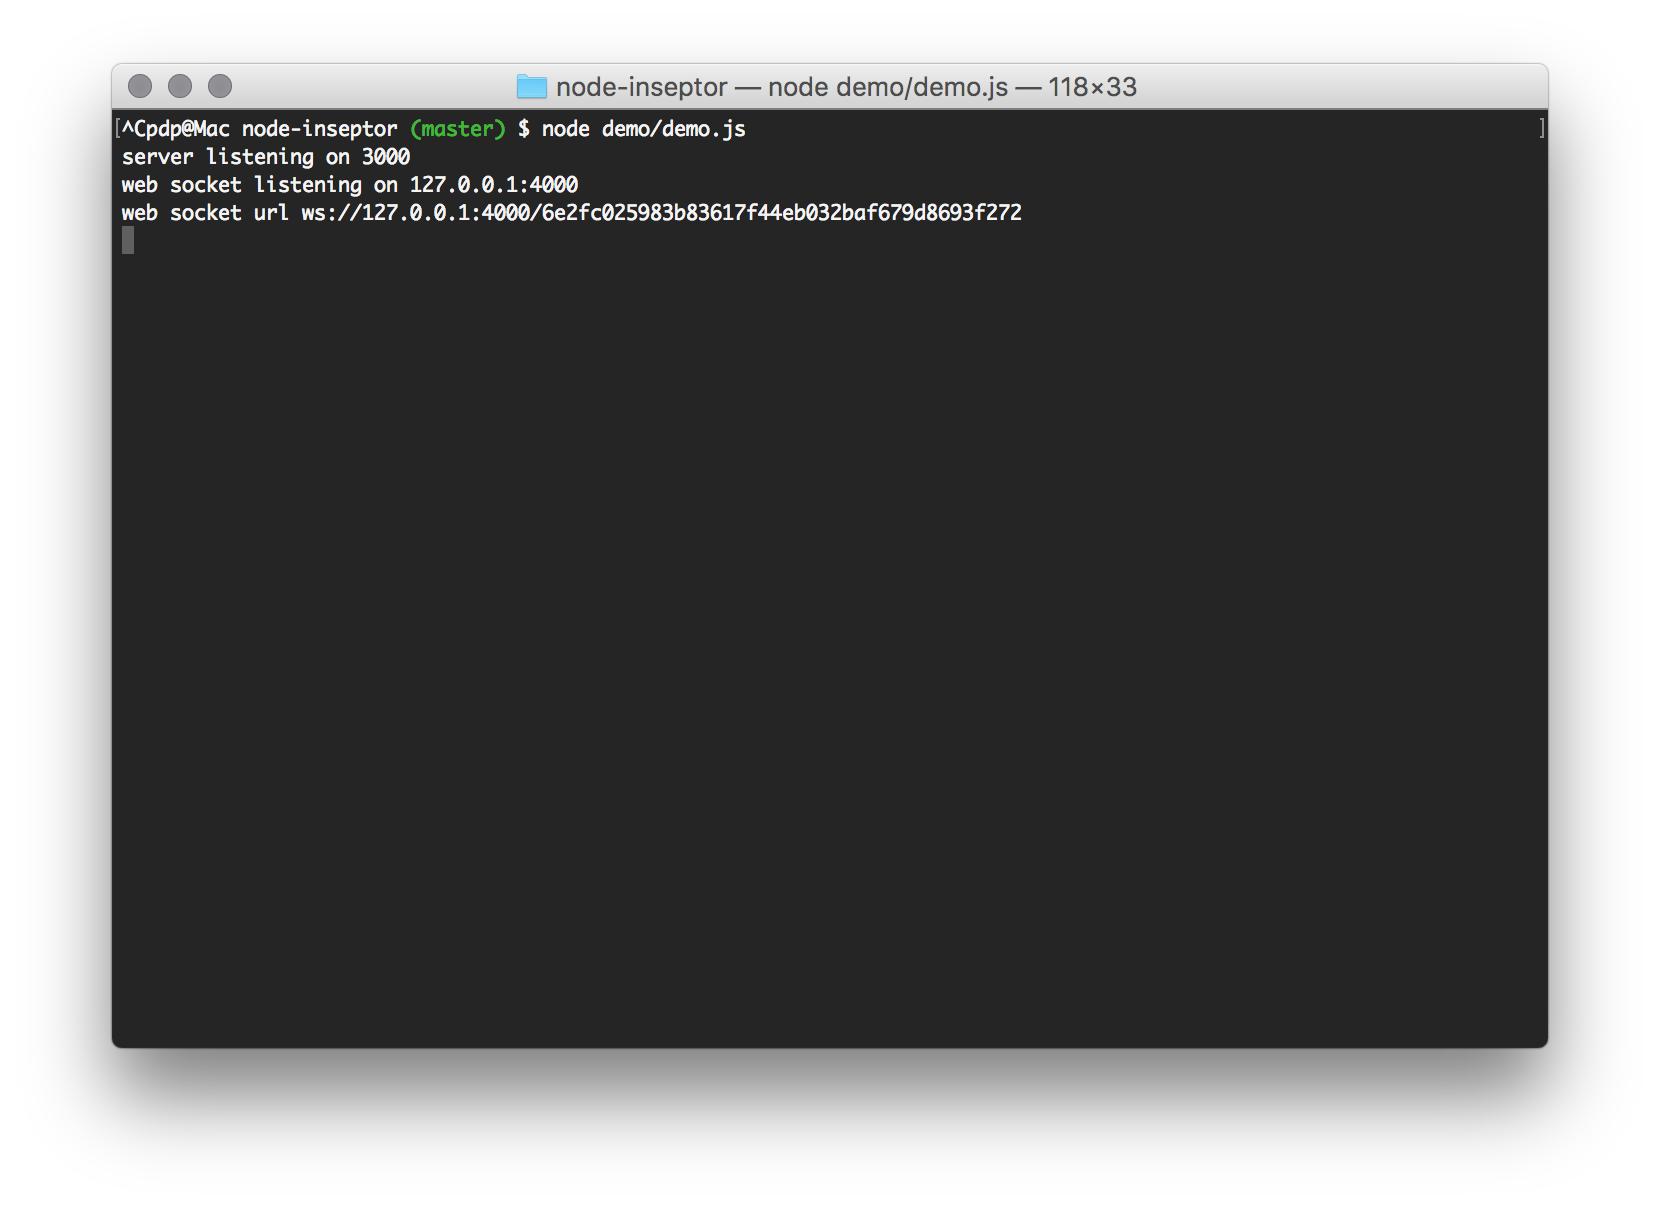
The 3 lines that we added do not modify the server in an adverse way. We expect the server to work as normal. You will see a couple of debug messages printed on the screen. The most important one is the web socket URL you will have to copy for the next step.
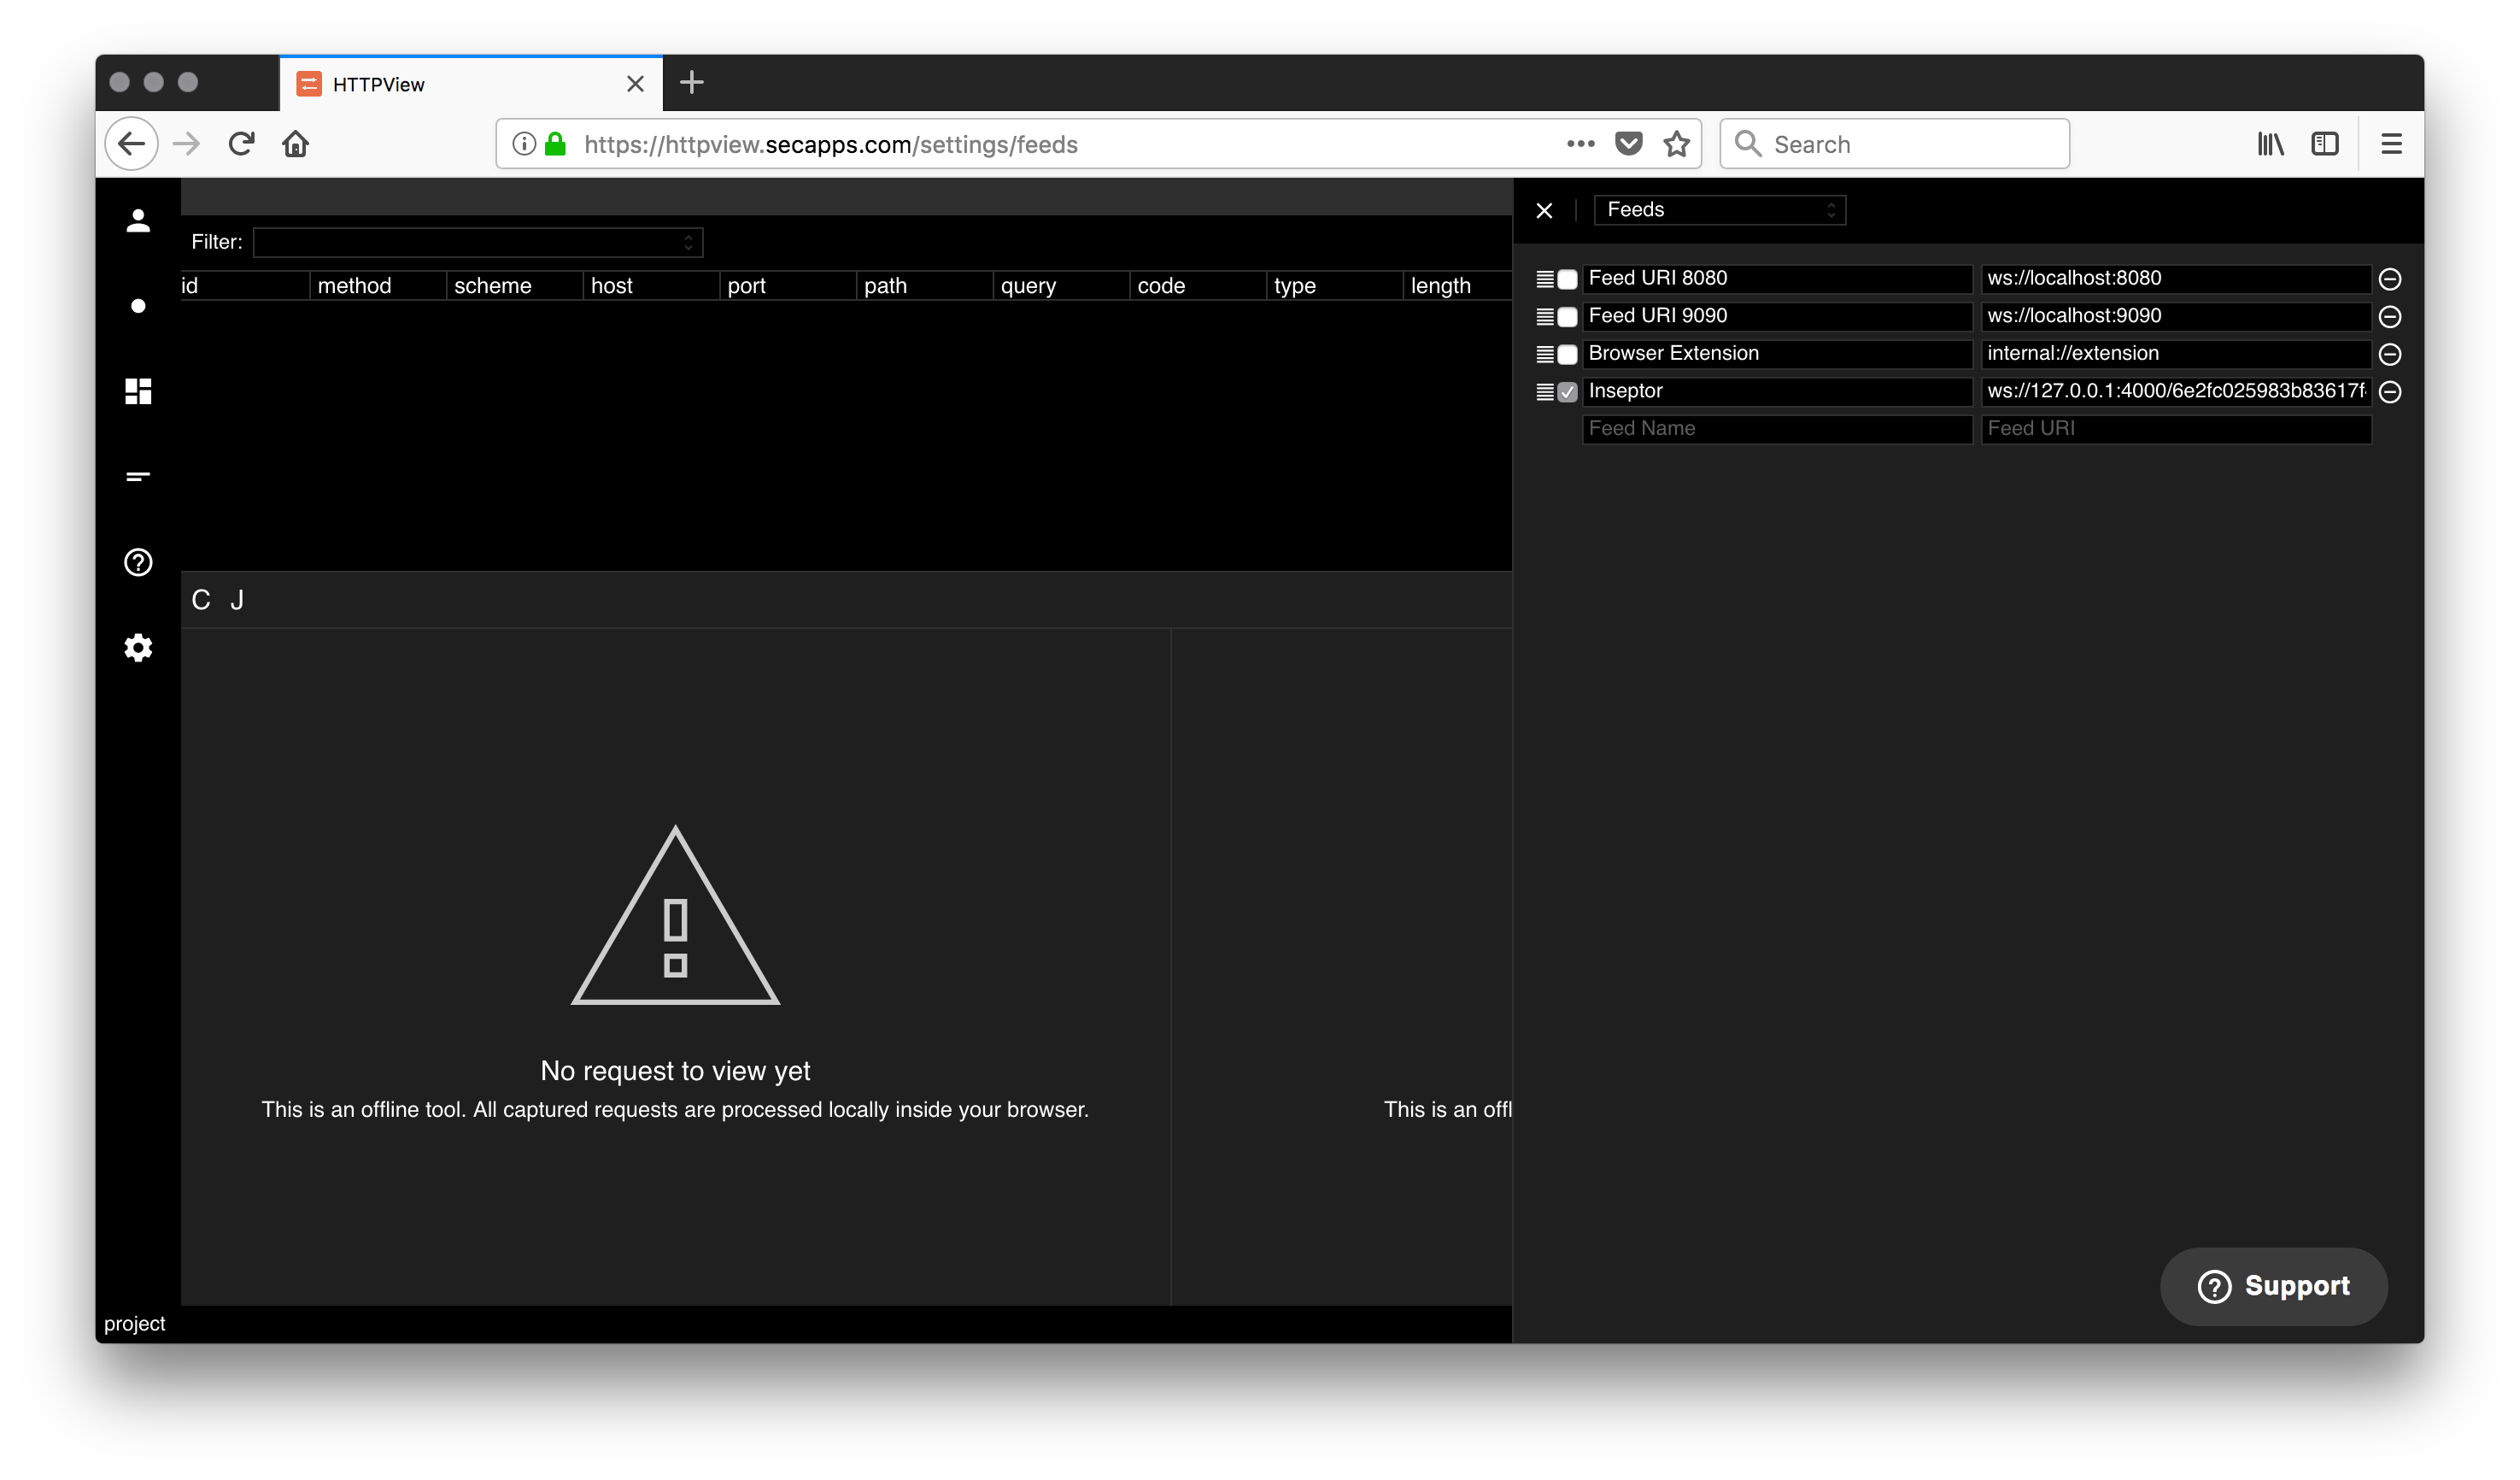
Now we need to launch HTTPView. The process is the same as with pown-proxy. Let's configure the feed URL. Just copy the endpoint URL from Inseptor and setup the HTTPView feed.
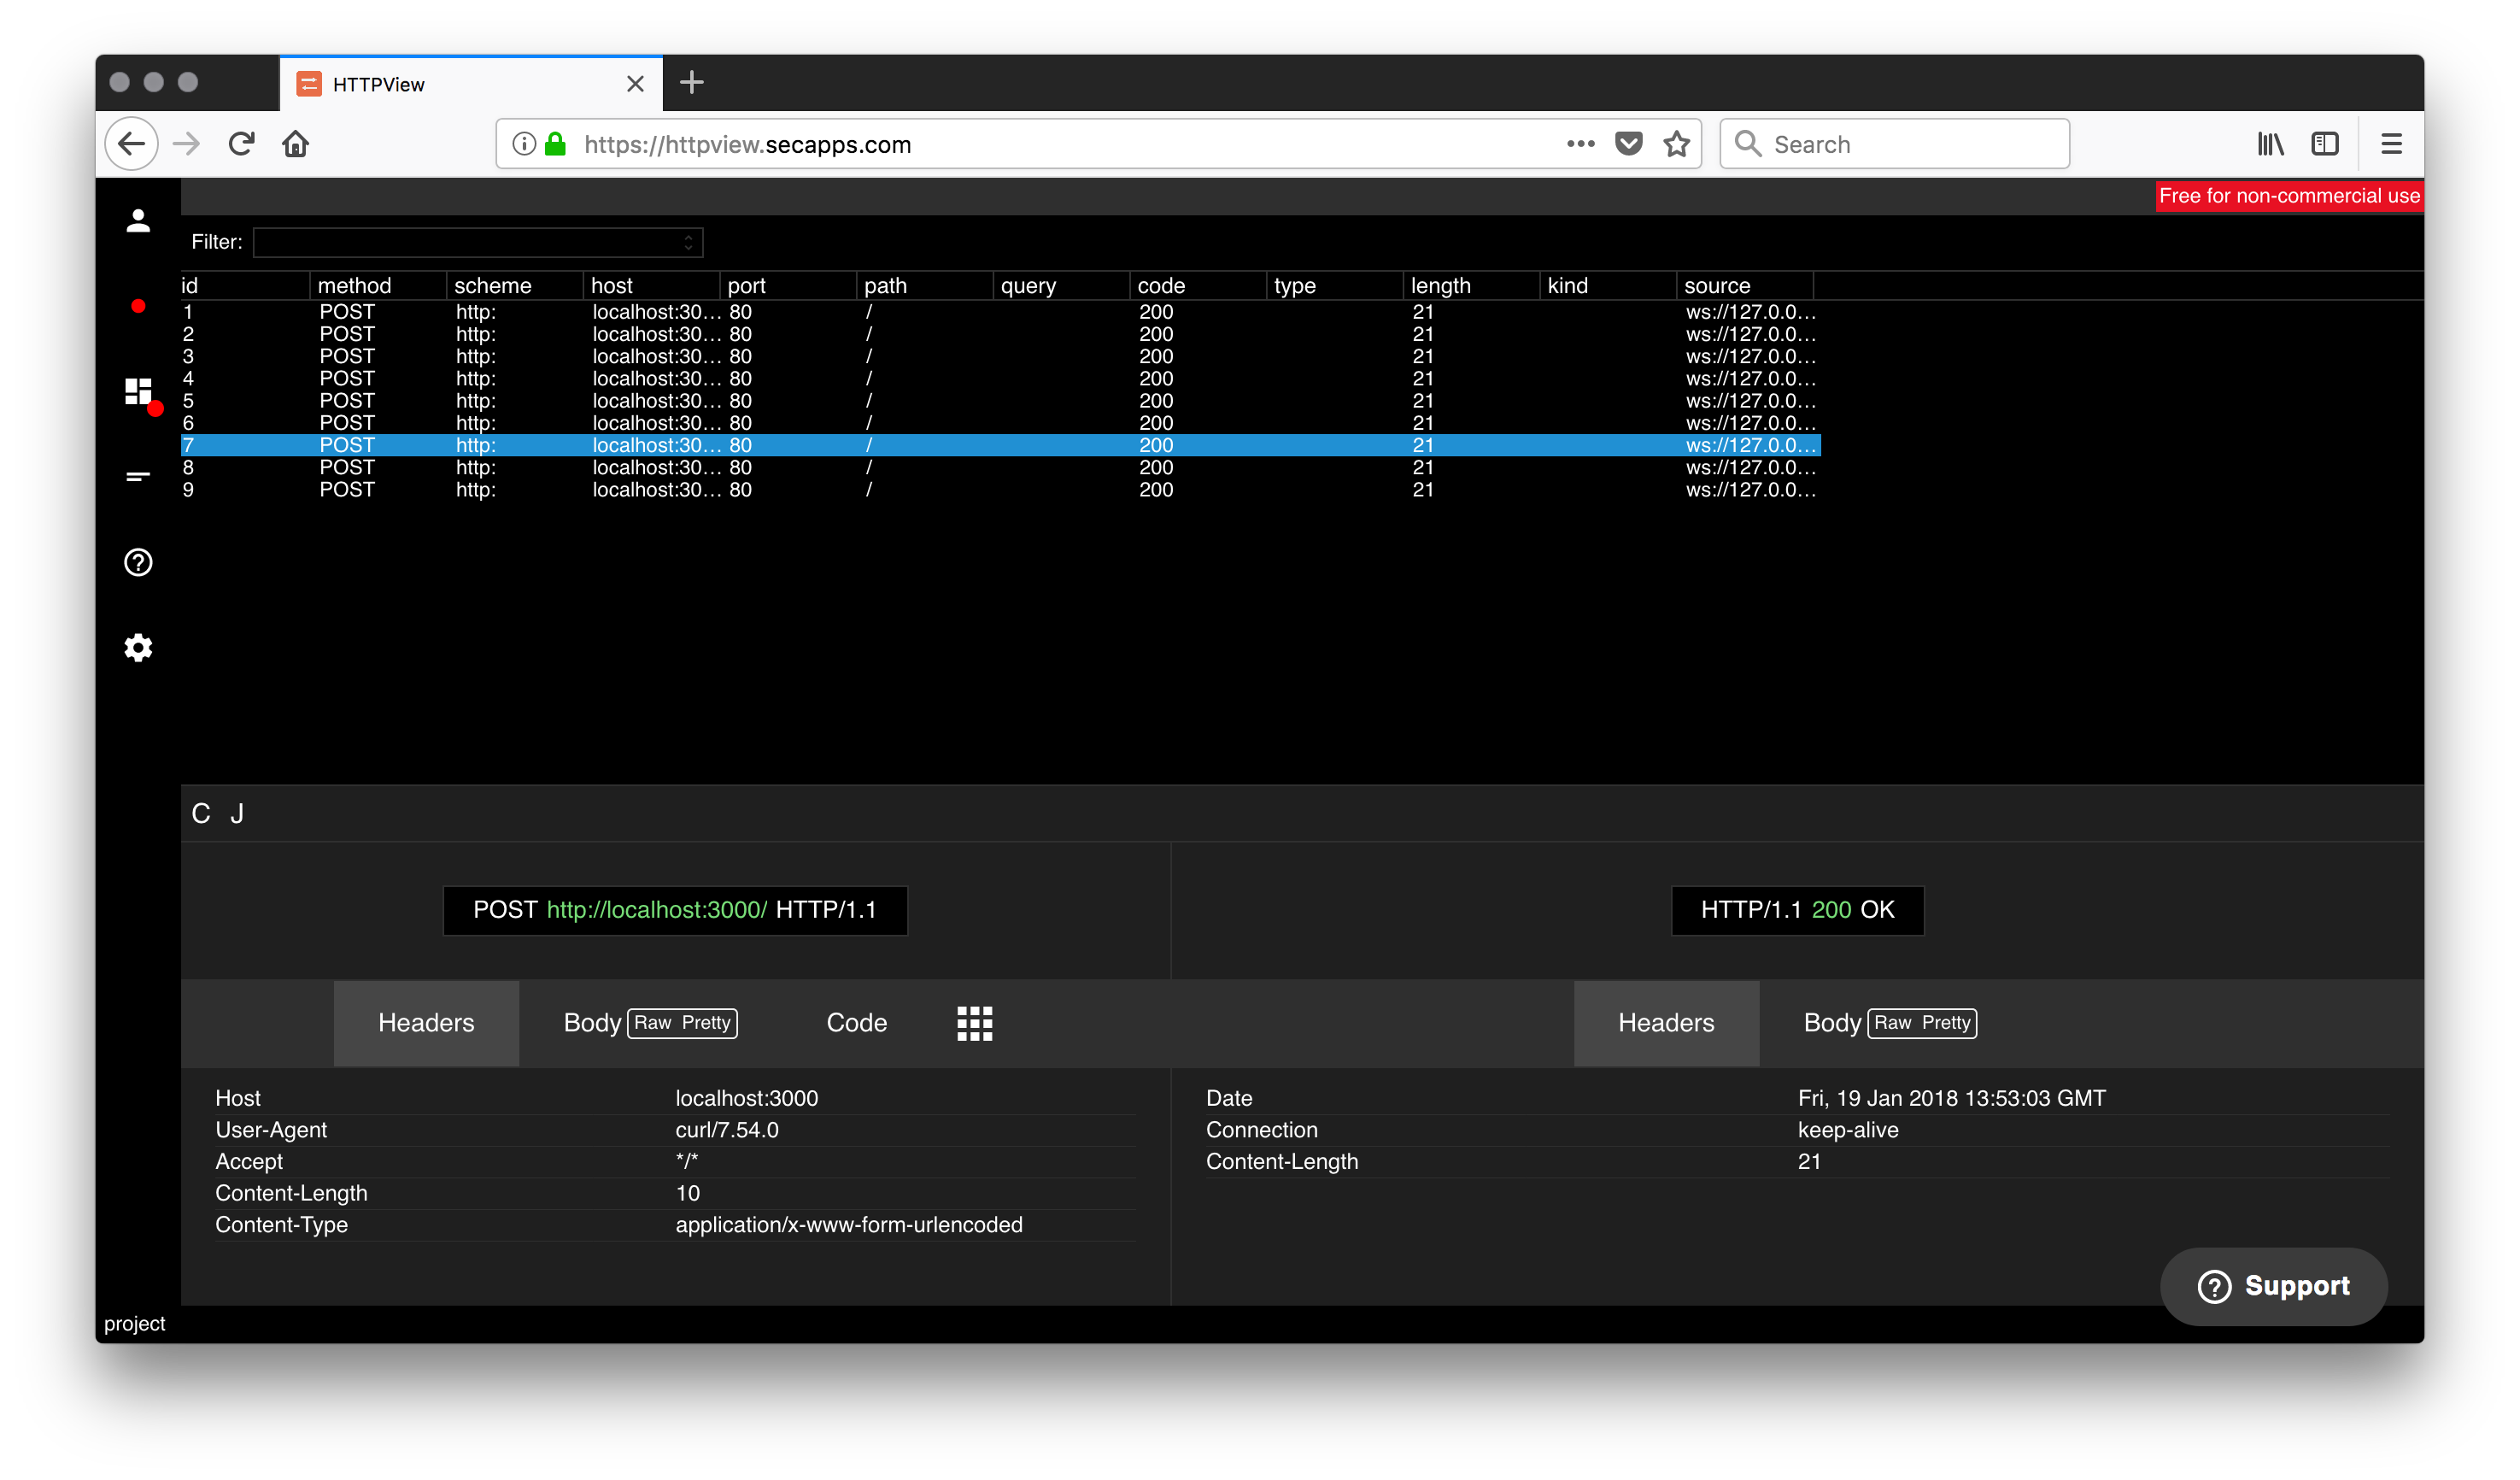
Once this is done, click the red dot button to begin recording your server. The output will look like this after you do a few curl requests from the command line. Notice no proxies! Everything is captured in full!
Eureka
This is a straightforward demo but it gives you a good idea how everything is done. In practice, we don't even need to integrate the Inseptor as a library. We did it here because it is easier but we are planning to provide a script that can supplement node to do the same. This means that you can debug without actually modifying your code.
The URLs that we generate for the socket connections contain a session key which we dynamically generate when the server is booted. This is to prevent accidental connections from malicious websites. If you don't know the string you cannot connect. This is important because the last thing we want to do is to allow someone malicious to access an endpoint that was accidentally put in this supervision mode. We will make some of these controls even more stringent in the upcoming version to be released soon.
Conclusion
Imagine running Inseptor in your non-prod environments. You can get a complete visibility of what each and every node is doing. Your colleagues can do that too. This gives you a lot of power. With the help of the rest of the tools in the online suite you can reach to numerous features instantly with zero configuration including the ability to reply the request and monitor the result back in real-time but also fuzz them so that you can quickly discover issues.
Security researchers can also benefit from this feature. It gives us the ability to inspect the process and execute various tools directly without the need for extra configuration. Although sometimes it is just easier to read the code, it is still better to apply some black-box techniques as well. But here is something else. HTTPView can analyse tainted requests. In theory, it is possible future versions to have the level of supervision required to identify subtle bugs which cannot be easily discovered through fuzzing. And that will be pretty awesome.
I would also like to mention that we are planning to build similar tools for Python, Ruby, Go, Rust, C# and so on. These tools will be simple in nature because the protocol is relatively simple to implement. Support for WebRTC as communication channel will also be welcome. Maybe you can help us build it.